Real Estate Statistics 2026: The Data Behind Wholesaling, Flipping, and Private Lending
TL;DR
- What the data says: Sales volume is at a 30-year low, flip margins hit their weakest point since 2008 before recovering slightly in Q1 2026, and real estate fraud losses nearly doubled from 2023 to 2025. Wholesaling and private lending both show tight, well-documented pricing bands.
- Two tiers of sources: Every proven number below carries a footnote AND a
verifiedprovenance marker resolved against a public claims ledger. Brand-new 2026 releases are labeled and linked, but not yet marked verified — see Cite This Data and Methodology. - Why it matters for deal flow: Thinner margins and rising fraud losses raise the cost of transacting with an unverified counterparty. See our verified profile system →
- Raw data: Download the dataset (CSV) — every verified stat on this page with its value, as-of date, and source. The file is rebuilt from the facts ledger on every deploy.
Real estate statistics 2026 tell a consistent story across every deal-flow channel: existing-home sales are stuck at the lowest pace since 1995 at 4.06 million [1], flip margins bottomed out at their weakest since 2008 before ticking up in Q1 2026, and real estate fraud losses hit $275.1 million [2] in 2025 alone. Wholesaling assignment fees averaged $13,000 nationally [3]. Private bridge-loan rates are newly clustering in a tight band this year (see below). Below is a chart and a citation for every number on this page, with a clear flag on anything brand-new that hasn't finished this site's verification pass yet.
Jump to a Section
- New-Home Prices Climbed, Then Cooled
- Mortgage Rates More Than Doubled
- Home Sales Are Stuck at 30-Year Lows
- Flip Profits: The Slowest Since 2008
- Flip ROI, Quarter by Quarter
- Wholesaling: What Assignment Fees Really Look Like
- Who's Actually Buying: Investors and Cash
- Real Estate Fraud Losses Are Accelerating
- Flip ROI's First Uptick in Two Years
- Private Lending Rates in Early 2026
- Why Verified Counterparties Matter More Now
- Cite This Data
New-Home Prices Climbed, Then Cooled
Cite.
<a href="https://estatedeals.club/market/real-estate-deal-flow-data-2026/#new-home-prices-climbed-then-cooled">Source: EstateDealsClub</a>
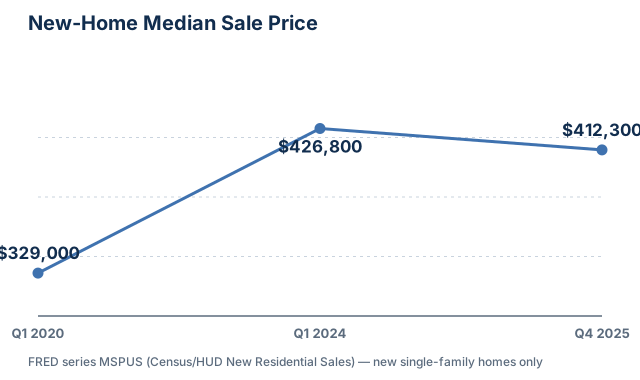
The median price of a new single-family home sold in the U.S. rose from $329,000 in Q1 2020 [4] to a peak of $426,800 in Q1 2024 [4], then eased to $412,300 by Q4 2025 [4] — a pullback from the peak, not a crash. That series (FRED's MSPUS, sourced from Census/HUD New Residential Sales data) tracks new construction only.
Existing-home resales moved on a lower, separate track: NAR's median existing-home price ran from $296,500 in full-year 2020 [1] to $407,500 in full-year 2024 [1] — the two series shouldn't be blended, since new construction and existing resales carry different cost structures. ATTOM's own blended measure, covering all recorded 2025 home sales, put the national median at $360,000 [5], a record for that specific series.
Mortgage Rates More Than Doubled
Cite.
<a href="https://estatedeals.club/market/real-estate-deal-flow-data-2026/#mortgage-rates-more-than-doubled">Source: EstateDealsClub</a>
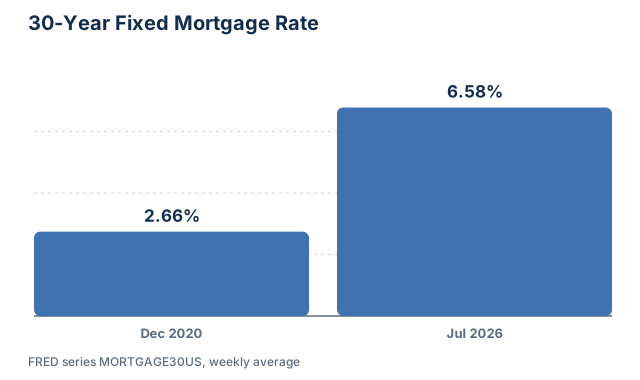
The 30-year fixed mortgage rate sat at 2.66% in December 2020 [4] — the pandemic-era floor — and had climbed to 6.58% by late July 2026 [4], per FRED's weekly MORTGAGE30US series. That's not a one-time jump; it's a multi-year repricing that reset what buyers can afford and what sellers can accept, and it's the single biggest reason the next chart looks the way it does.
Every deal-flow number that follows sits downstream of this one: financing cost, not inventory, has been the primary constraint on transaction volume since rates left their 2020-2021 floor.
Home Sales Are Stuck at 30-Year Lows
Cite.
<a href="https://estatedeals.club/market/real-estate-deal-flow-data-2026/#home-sales-are-stuck-at-30-year-lows">Source: EstateDealsClub</a>
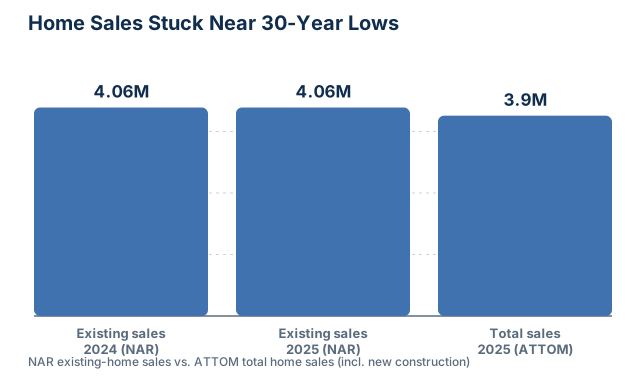
Existing-home sales totaled 4.06 million in 2024 [1] — the lowest annual total since 1995 — and stayed flat at 4.06 million in 2025 [1], matching that same three-decade low for a second straight year. ATTOM's broader measure, covering all recorded 2025 sales, put total volume at 3.9 million [5]. The Census Bureau's Q1 2026 homeownership rate held at 65.3% [6], essentially unchanged from a year earlier — a sign this is a transaction slowdown, not a mass sell-off.
Two flat years in a row at the lowest sales pace since 1995 is itself the headline: this isn't a one-quarter dip, it's a structural stall that every deal-sourcing channel in this market has had to adapt around.
Flip Profits: The Slowest Since 2008
Cite.
<a href="https://estatedeals.club/market/real-estate-deal-flow-data-2026/#flip-profits-the-slowest-since-2008">Source: EstateDealsClub</a>
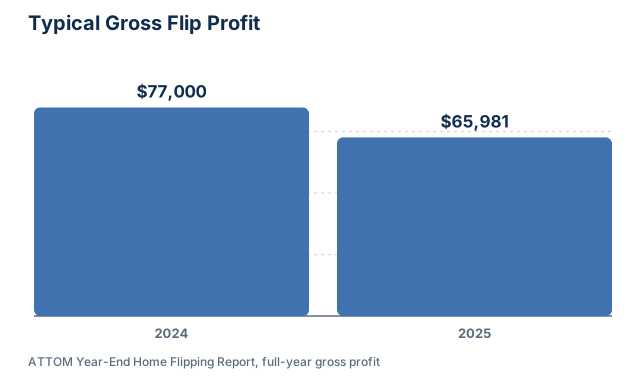
The typical flipped home netted $77,000 in gross profit in 2024 [7], falling to $65,981 in 2025 [7]. Full-year gross ROI fell alongside it, from 32.1% to 25.5% [7] — the lowest annual return recorded since 2008. Flip volume followed the same direction: 297,045 homes were flipped nationwide in 2025 [7], 7.4% of all home sales [7], both down slightly from 2024.
That 2008 comparison is doing real work here. It's the first time since the last housing crash that flip margins have compressed this far — a genuine structural squeeze, not routine year-to-year noise.
Flip ROI, Quarter by Quarter
Cite.
<a href="https://estatedeals.club/market/real-estate-deal-flow-data-2026/#flip-roi-quarter-by-quarter">Source: EstateDealsClub</a>
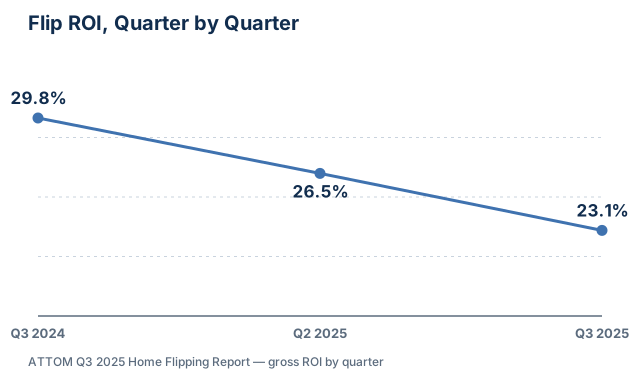
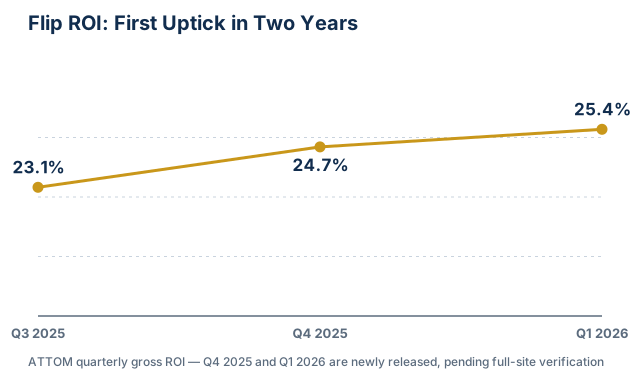
ATTOM's quarterly reporting shows the same compression in finer detail: gross flip ROI ran 29.8% in Q3 2024 [8], eased to 26.5% by Q2 2025 [8], and fell to 23.1% in Q3 2025 [8] — a straight-line decline, one full year, no quarter bucking the trend. Every quarter in this window printed a lower margin than the one before it.
That streak is exactly why the Q1 2026 reading later on this page (see Flip ROI's First Uptick) is worth flagging as new data the moment it's reported, even before it's run through this site's full verification pipeline.
Wholesaling: What Assignment Fees Really Look Like
Cite.
<a href="https://estatedeals.club/market/real-estate-deal-flow-data-2026/#wholesaling-what-assignment-fees-really-look-like">Source: EstateDealsClub</a>
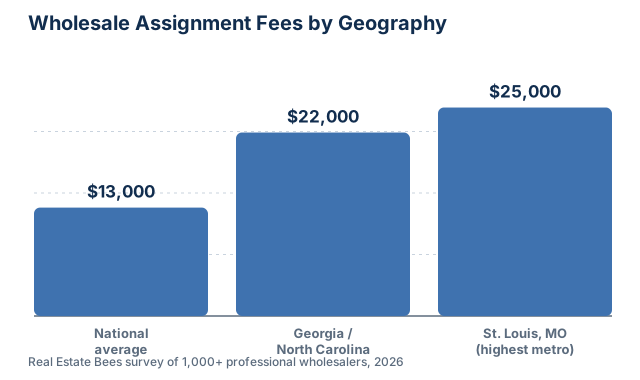
Real Estate Bees surveyed more than 1,000 professional wholesalers nationwide [3] and found an average assignment fee of $13,000 [3]. That average hides wide geographic spread: Georgia and North Carolina averaged $22,000 [3], and St. Louis posted the highest metro-level average at $25,000 [3] — roughly double the national figure.
A wholesaler pricing a deal off the national average alone, without checking their local comp, is leaving money on the table in high-fee metros and pricing themselves out of a deal in low-fee ones.
Who's Actually Buying: Investors and Cash
Cite.
<a href="https://estatedeals.club/market/real-estate-deal-flow-data-2026/#whos-actually-buying-investors-and-cash">Source: EstateDealsClub</a>
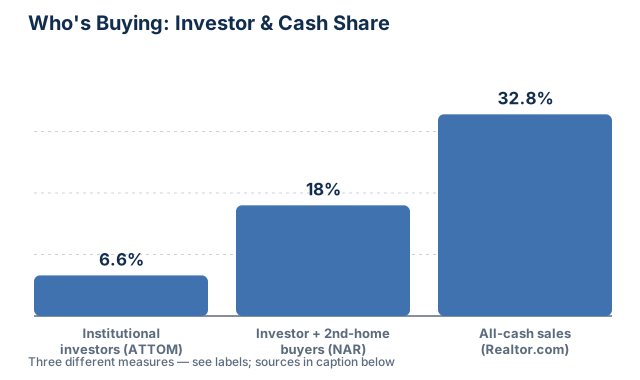
Three different measures, three different definitions — worth reading each on its own terms. Institutional investors (large-scale buyers, per ATTOM's definition) purchased 6.6% of all U.S. homes sold in 2025 [5], the second straight year at that level. NAR's broader category — individual investors plus second-home buyers combined — reached 18% of transactions in November 2025 [1]. And nationwide, 32.8% of all home sales in the first half of 2025 closed all-cash [9], per Realtor.com's research team.
None of these three numbers measure the same population, so they shouldn't be added together — but together they show a market where cash and investor activity are a large, durable minority of every closing, not a fringe case.
Real Estate Fraud Losses Are Accelerating
Cite.
<a href="https://estatedeals.club/market/real-estate-deal-flow-data-2026/#real-estate-fraud-losses-are-accelerating">Source: EstateDealsClub</a>
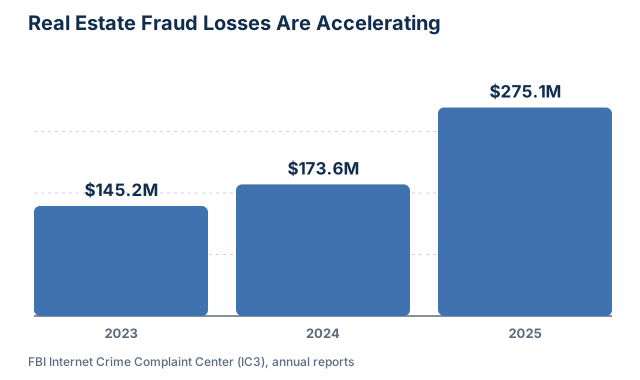
The FBI's Internet Crime Complaint Center tracked $145.2 million in real estate fraud losses in 2023 [2], rising to $173.6 million in 2024 [2], then to $275.1 million across 12,368 complaints in 2025 [2]. That's a near-doubling in two years, in a category the FBI itself flags as a growing threat to housing professionals and their clients. On the recovery side, IC3's Recovery Asset Team reported a 66% success rate [2] freezing wire transfers reported within its 72-hour intervention window [2] — proof that fast reporting materially changes the outcome.
Fraud losses climbing while flip margins compress is not a coincidence worth ignoring — see the analysis below.
Flip ROI's First Uptick in Two Years
Cite.
<a href="https://estatedeals.club/market/real-estate-deal-flow-data-2026/#flip-rois-first-uptick-in-two-years">Source: EstateDealsClub</a>
A Q1 2026 industry report puts flip ROI at 25.4%, up from 24.7% the previous quarter — the first quarter-over-quarter increase in flip margins in nearly two years, after seven straight quarters of decline. The same report puts flip volume at roughly 64,000 homes for the quarter, about 8% of all home sales in the period, and typical gross profit at about $66,000, up from roughly $64,300 the quarter before. Read the primary source directly.
This continues the exact series charted above — same metric, same methodology, one quarter later. It just hasn't gone through this site's fact-ledger snapshot process yet, so it's flagged here rather than folded silently into the proven chart.
Private Lending Rates in Early 2026
Cite.
<a href="https://estatedeals.club/market/real-estate-deal-flow-data-2026/#private-lending-rates-in-early-2026">Source: EstateDealsClub</a>
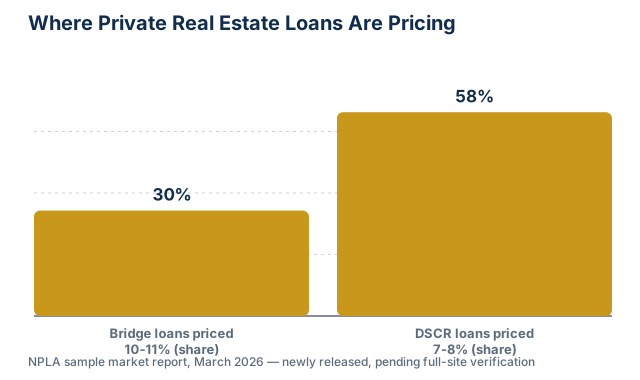
A March 2026 private-lending market report puts bridge-loan pricing in a tight band: roughly 30% of bridge loans priced between 10% and 11%, with nearly three-quarters falling between 9% and 12%. DSCR rental-property loans cluster lower and tighter still — about 58% land between 7% and 8%. Bridge points run around a 2.4% median against roughly 1.6% for DSCR. Read the primary source directly. For scale, the broader private-credit market — not real-estate-specific — stood at roughly $3 trillion at the start of 2025 [10], up from about $2 trillion in 2020 [10].
Tight rate clustering like this means private lenders are competing on speed and certainty of execution more than on rate — which raises the value of a borrower who can prove their track record fast.
Why Verified Counterparties Matter More Now
Three trends on this page point the same direction. Flip margins compressed to their lowest since 2008 before their first uptick in two years [7]. Real estate fraud losses nearly doubled in two years to $275.1 million [2]. And mortgage delinquencies, while still moderate at 3.92% [11] as of Q3 2024, sit against a rate environment more than double its 2020 floor. Thinner margins mean less room to absorb a bad counterparty — a stacked assignment fee, an unfunded buyer, a lender who can't actually close. Rising fraud losses mean the downside of skipping verification keeps getting worse, not better.
In our experience building deal-matching infrastructure for wholesalers, flippers, and private lenders, the investors who keep closing in a tighter market are the ones who can verify who they're transacting with before money moves — not after a deal falls through. That's the entire premise behind Estate Deals Club's SMS-verified profiles, visible reviews, and transaction history. Set up your verified profile — free, no credit card →
Cite This Data
Every chart on this page traces to a primary source listed below. To cite this page directly:
Estate Deals Club, Real Estate Statistics 2026: The Data Behind Wholesaling, Flipping, and
Private Lending. EstateDealsClub.com, accessed [date]. Source:
https://estatedeals.club/market/real-estate-deal-flow-data-2026
Please cite the original primary source (ATTOM, NAR, FRED, or the FBI, linked in each section and in Sources below) for any individual statistic — this page aggregates and charts their published numbers, it doesn't originate them.
Methodology and New-Data Notes
Every proven statistic on this page carries an inline provenance marker resolved against a public claims ledger, checked automatically on every publish: the exact value must appear verbatim inside a quoted sentence from the linked primary source. Numbers pulled from more than one measure (home price, sales volume, buyer composition) are labeled by their exact source and definition in the surrounding text. This page deliberately keeps FRED's new-home price data separate from NAR's existing-home price data, and keeps ATTOM's blended sales figures distinct from both, because each series measures a different population.
Two sections — Flip ROI's First Uptick in Two Years and Private Lending Rates in Early 2026 — cite figures released after this page's last fact-verification pass. Those numbers link directly to their primary source (ATTOM's Q1 2026 Home Flipping Report and the NPLA's March 2026 sample market report) so you can verify them yourself right now; they're intentionally not run through the site's automated provenance marker yet, and will be promoted to fully verified status once that check completes.
Related Topics
- How EDC Builds Trust Into Every Transaction
- Real Estate Wire Fraud Protection
- Build Investor Reputation and Credibility
- Fix and Flip Guide 2026
- TCPA Compliance Real Estate: Avoid $53K Fines
- Real Estate Data Accuracy Problems
FAQ
Q: Where does the data on this page come from?
A: Every proven number links to a named primary source — ATTOM, NAR, FRED, the FBI's Internet Crime Complaint Center, Real Estate Bees, Realtor.com, the Census Bureau, the Mortgage Bankers Association, or Morgan Stanley. Two sections cite brand-new 2026 releases that are clearly labeled as pending this site's automated verification pass, with a direct link to the original report so you can check them yourself.
Q: Why do the home-price numbers differ between charts?
A: They measure different things. FRED's MSPUS series covers new single-family homes only. NAR's median tracks existing-home resales. ATTOM's figure blends all recorded sales. All three are real and correctly sourced — they're just not the same population, so this page keeps them labeled separately instead of implying a single "the" home price.
Q: Is flip ROI actually recovering, or is 25.4% still bad?
A: Both. 25.4% in Q1 2026 is the first quarter-over-quarter increase in flip margins in nearly two years, ending seven straight quarters of decline. It's also still well below the 32.1% full-year average from 2024 [7]. A one-quarter uptick after a long decline is a data point worth flagging, not a declared trend reversal.
Q: How often is this page updated?
A: The proven statistics are re-checked against their live sources on a recurring freshness cycle; the two "pending verification" sections get promoted to fully-cited status once their sources clear that same check. The createdAt date in this page's metadata reflects the last full content pass.
Q: Can I use these charts and numbers elsewhere?
A: Yes — see Cite This Data for a ready-to-use attribution line. Please cite the original primary source (linked in every section and in Sources) for the underlying statistic itself, since this page aggregates and visualizes their published data rather than originating it.